Enregistrez gratuitement cette image
en 800 pixels pour usage maquette
(click droit, Enregistrer l'image sous...)
|
|
Réf : V01823
Thème :
Terre vue de l'espace - Villes (375 images)
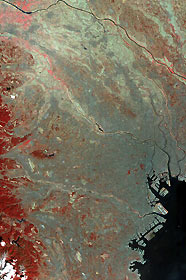
Titre : Image of Tokyo
Description : (La description de cette image n'existe qu'en anglais)
This image of the city of Tokyo was acquired on March 22, 2000. With its 14 spectral bands from the visible to the thermal infrared wavelength region, and its high spatial resolution of 15 to 90 meters (about 50 to 300 feet), the satellite will image the earth for the next 6 years to map and monitor the changing surface of our planet.This false color infrared image covers an area 60 km wide and 75 km long in three bands of the short wavelength infrared region, with a spatial resolution of 15 m. It shows part of the Tokyo metropolitan area extending south to Yokohama; included are the Ginza District, Haneda airport and the Imperial Palace. To the west, Tokyo is hemmed in by mountains, covered with forests (displayed in red); on the southeast, Tokyo Bay is one of the world's great harbors. A joint U.S./Japan science team is responsible for validation and calibration of the instrument and the data products. Dr. Anne Kahle at NASA's Jet Propulsion Laboratory, Pasadena, California, is the U.S. Science team leader; Moshe Pniel of JPLis the project manager. The primary goal of the mission is to obtain high-resolution image data in 14 channels over the entire land surface, as well as black and white stereo images. With revisit time of between 4 and 16 days, the satellite will provide the capability for repeat coverage of changing areas on Earth's surface.The broad spectral coverage and high spectral resolution of the satellite will provide scientists in numerous disciplines with critical information for surface mapping, and monitoring dynamic conditions and temporal change. Example applications are: monitoring glacial advances and retreats; monitoring potentially active volcanoes; identifying crop stress; determining cloud morphology and physical properties; wetlands evaluation; thermal pollution monitoring; coral reef degradation; surface temperature mapping of soils and geology; and measuring surface heat balance.
|
|

